“Pixel methods” for ultrasound

Matthew Faytak
University at Buffalo
NTU invited workshop


Refresher: contour extraction

Contours can be extracted from the ultrasound image using a combination of human-generated hints and automatic processing Iskarous (2005); Stone (2005)

Refresher: ultrasound data analysis

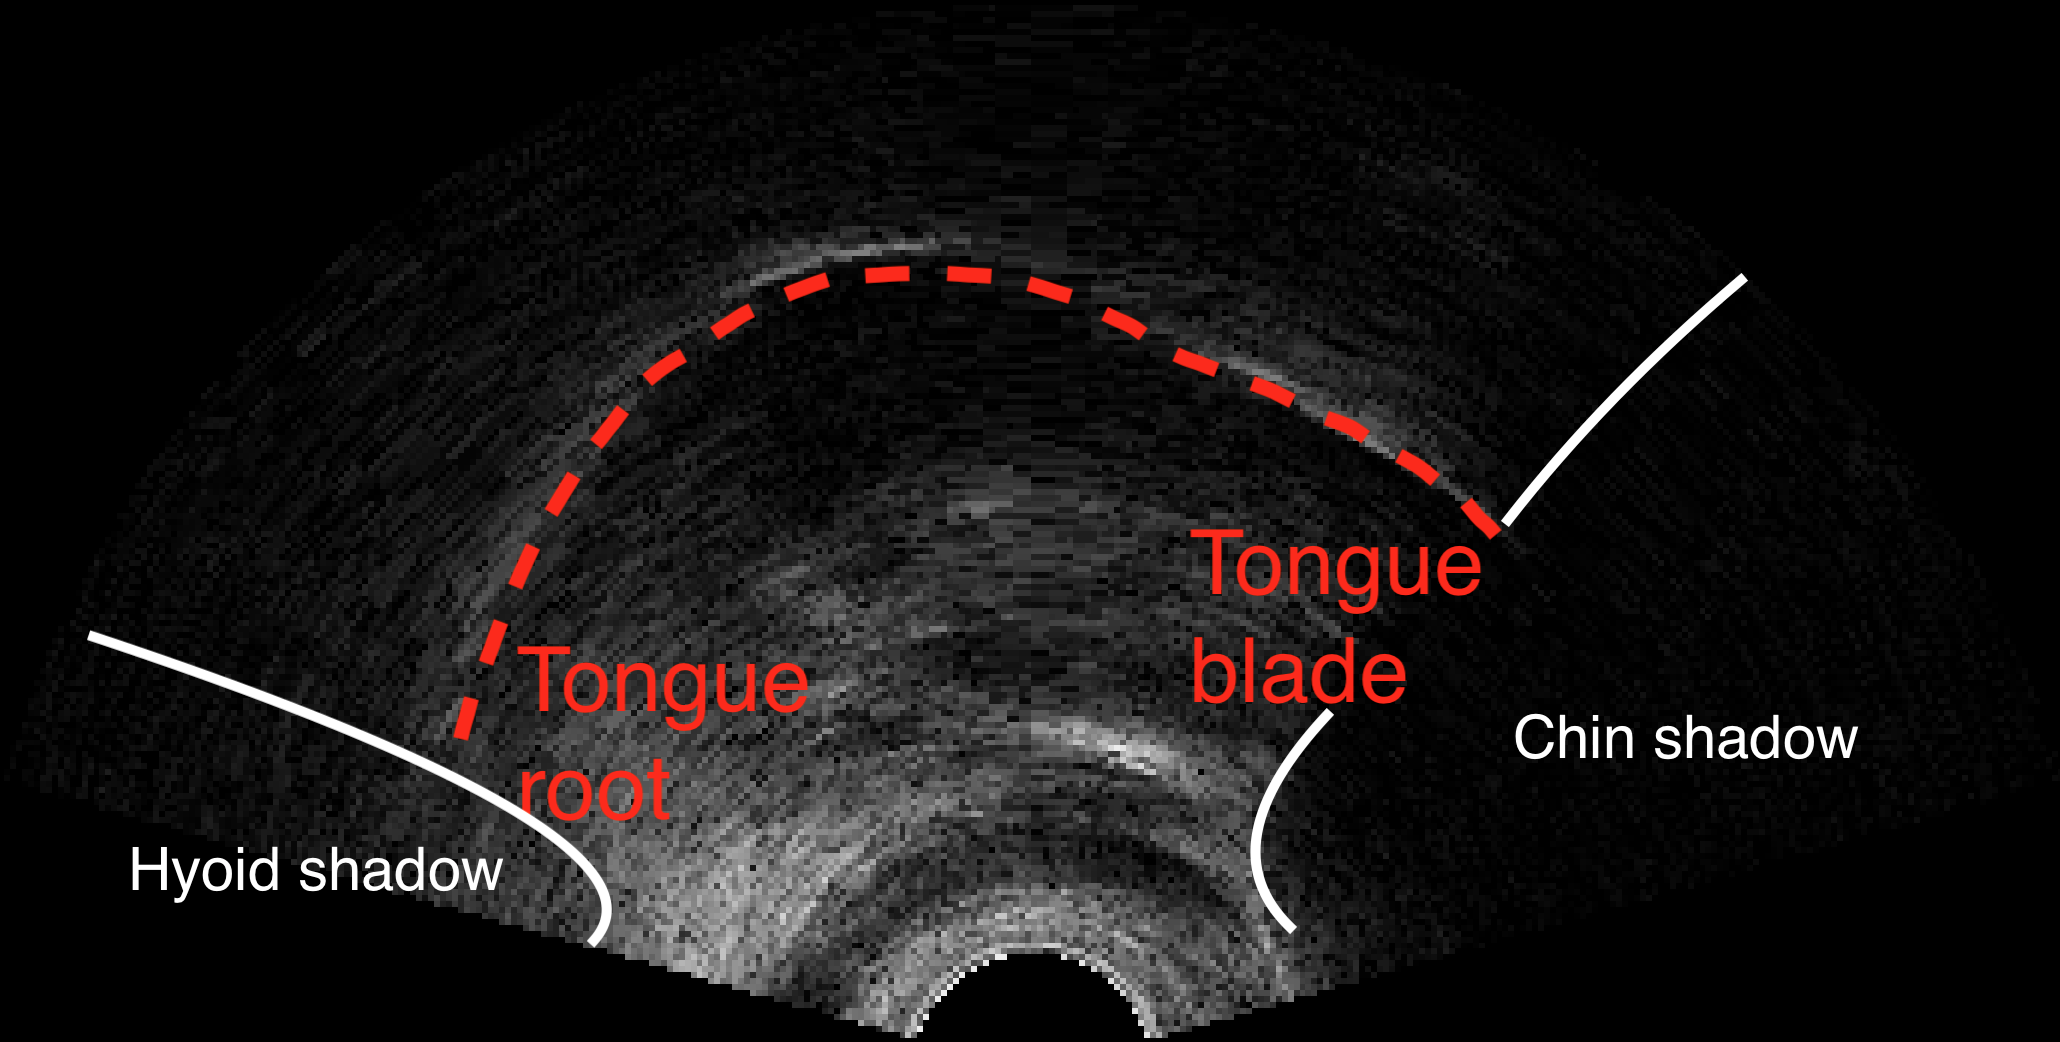
Usually done on contours with a spline model which can handle non-linear patterns (like tongue shapes) Davidson (2006); Heyne et al (2019)

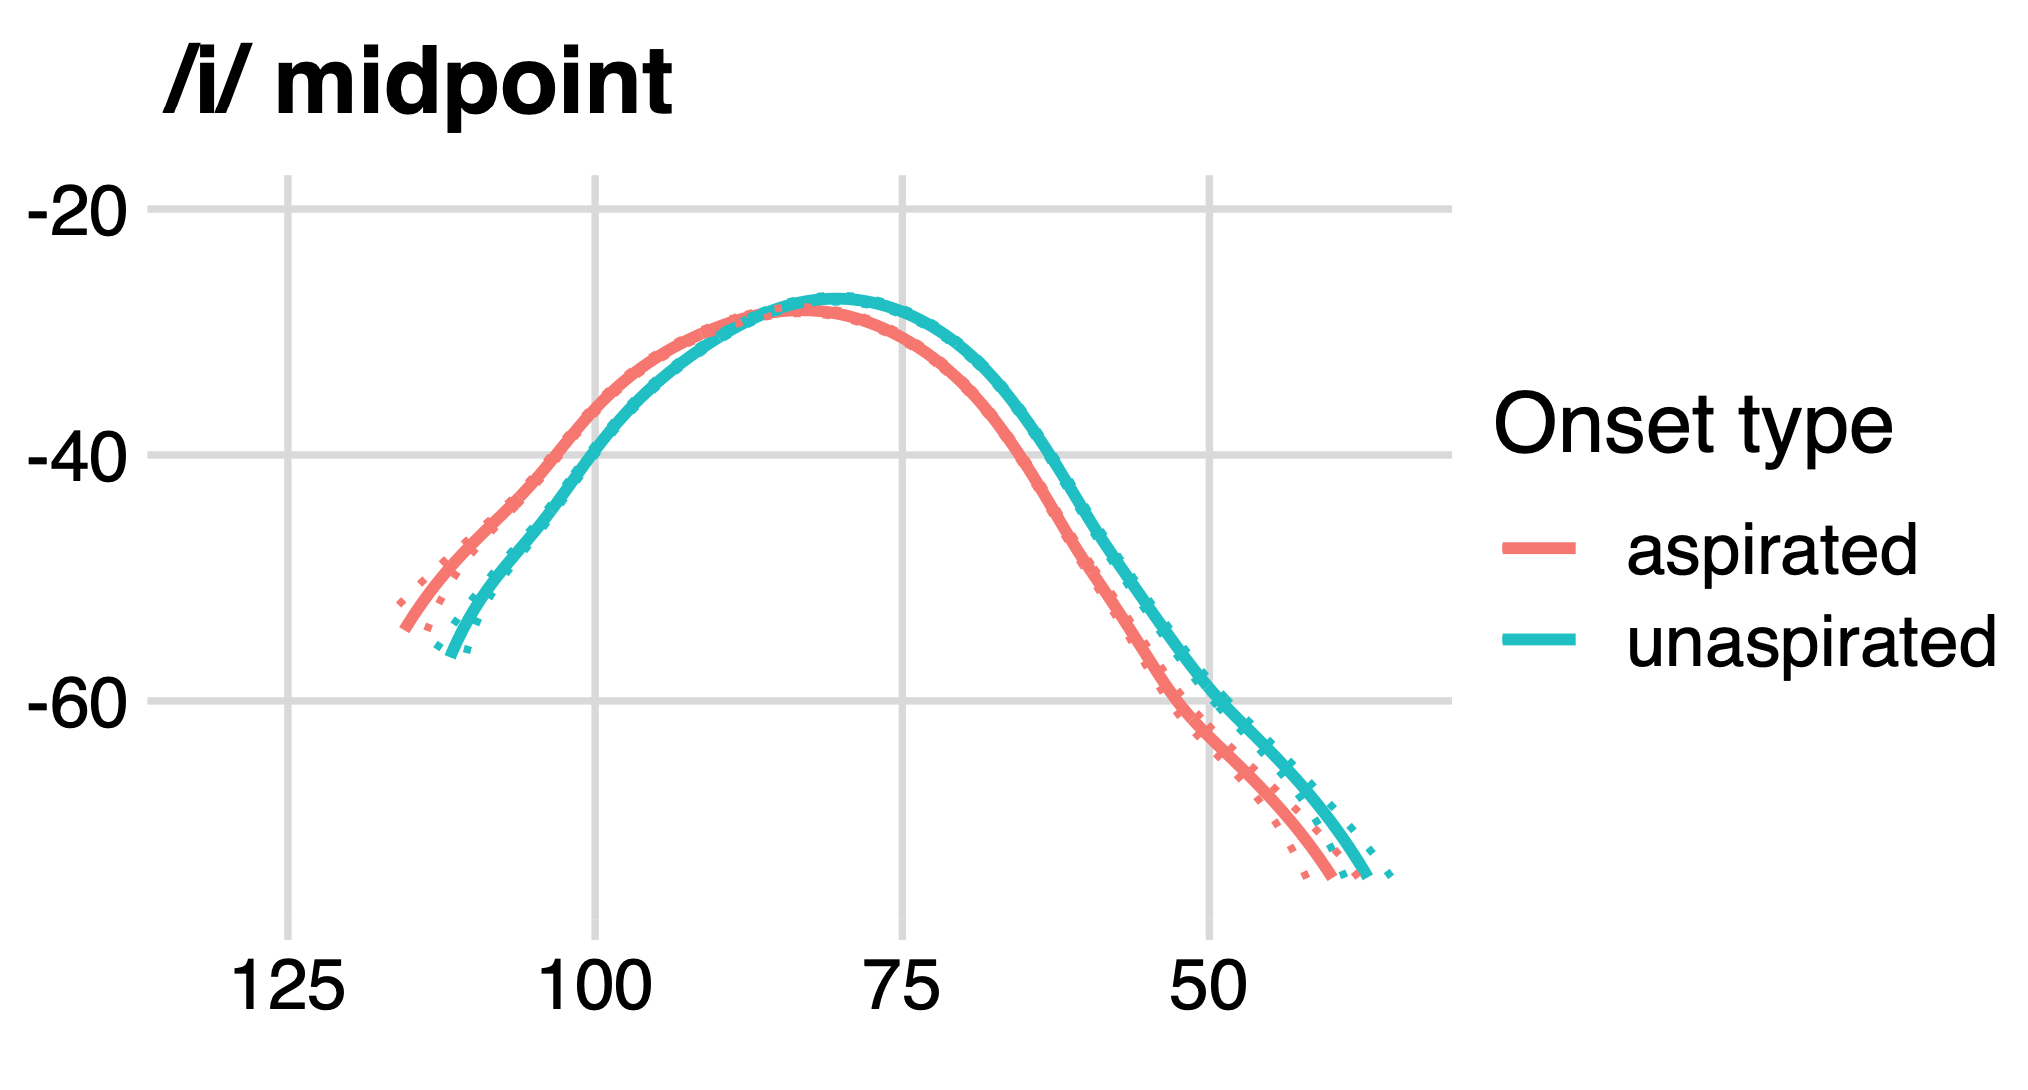
figure from Weller et al. (to appear)

Overview: this lecture

Various types of feature engineering

All get around feature extraction and the need for (most) human intervention by focusing on image’s pixels as a set of features

Pixel-based motion detection

Pixels

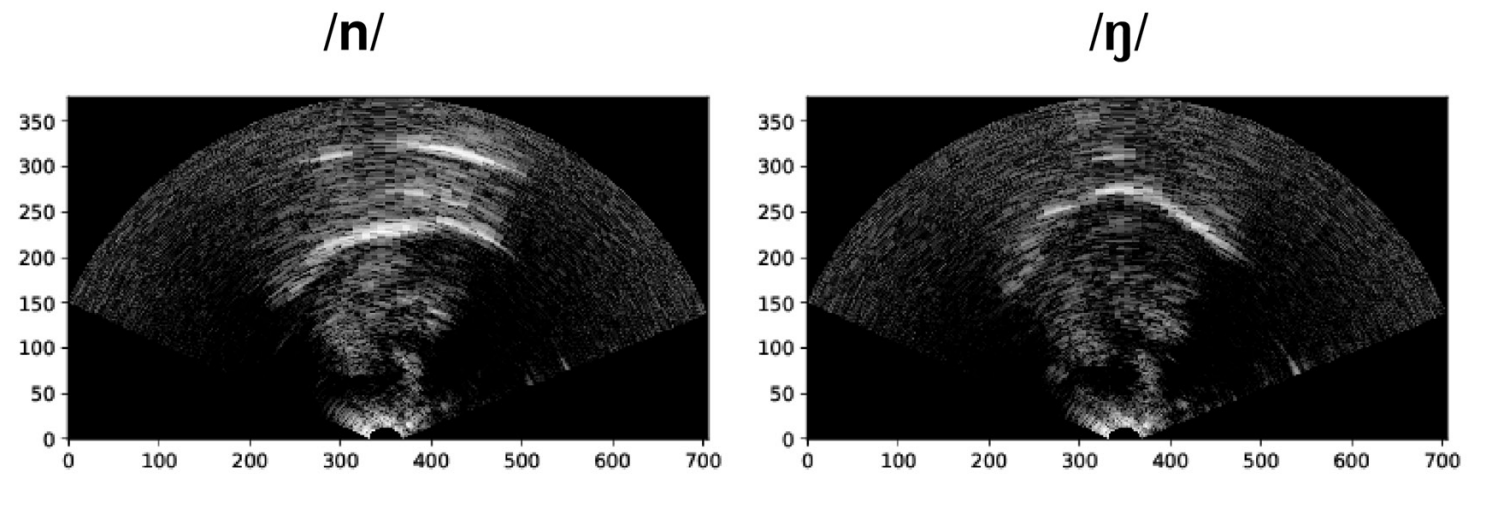
Each ultrasound image is composed of tens of thousands of pixels, each of which has a numerical value indicating brightness

Pixel shape

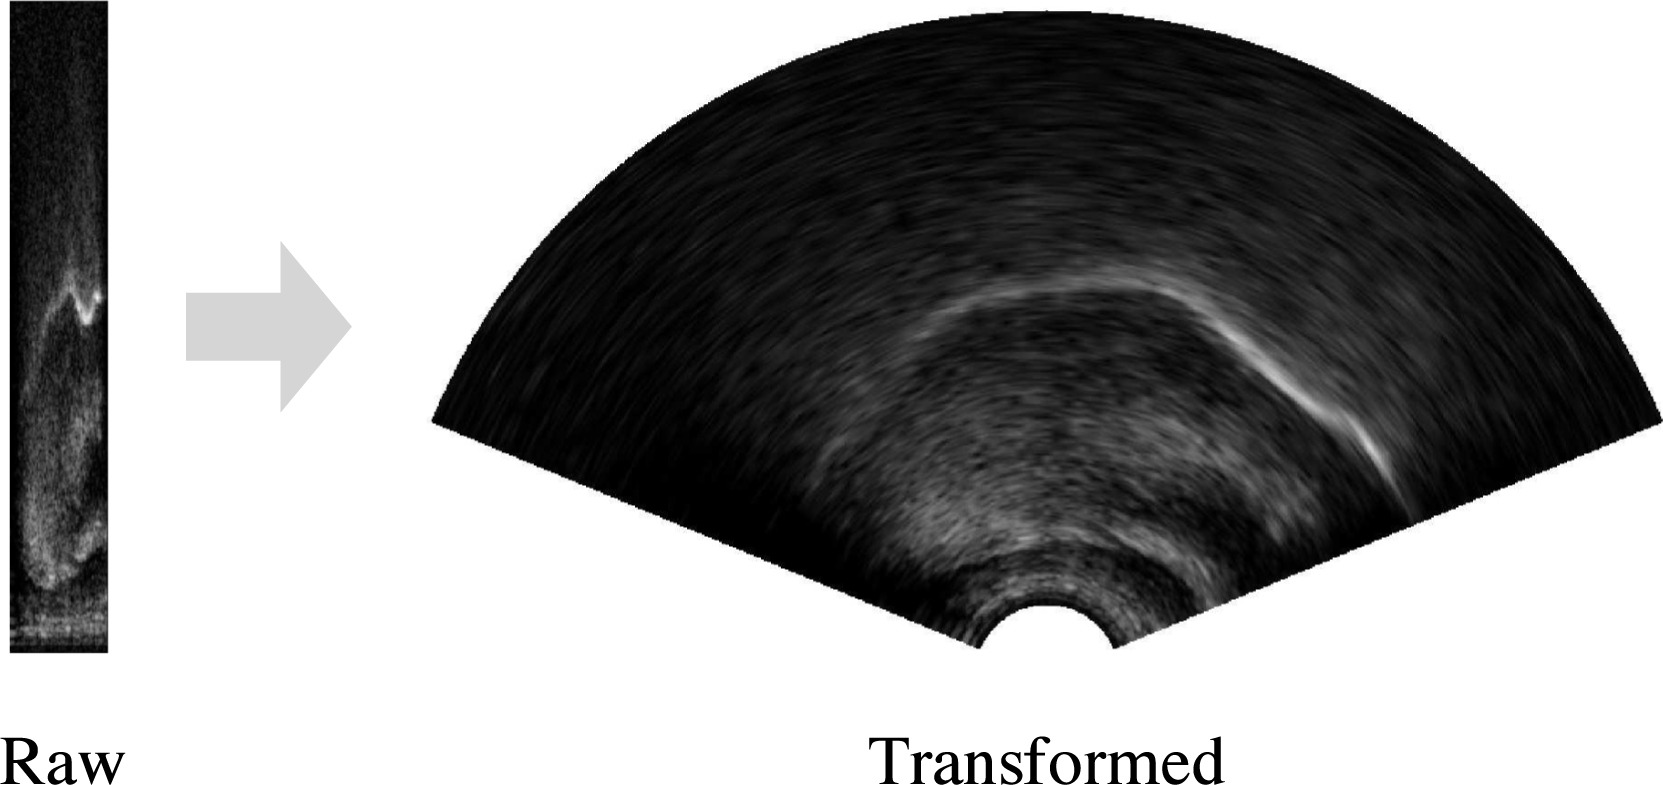
The pixels are arc-shaped in most ultrasound frames because the raw reflection data is stored as a rectangular grid Wrench & Scobbie (2008); Eshky et al (2021)

This grid is transformed to real-world proportions before we work with it figure from Eshky et al (2021)

Pixel difference (PD)

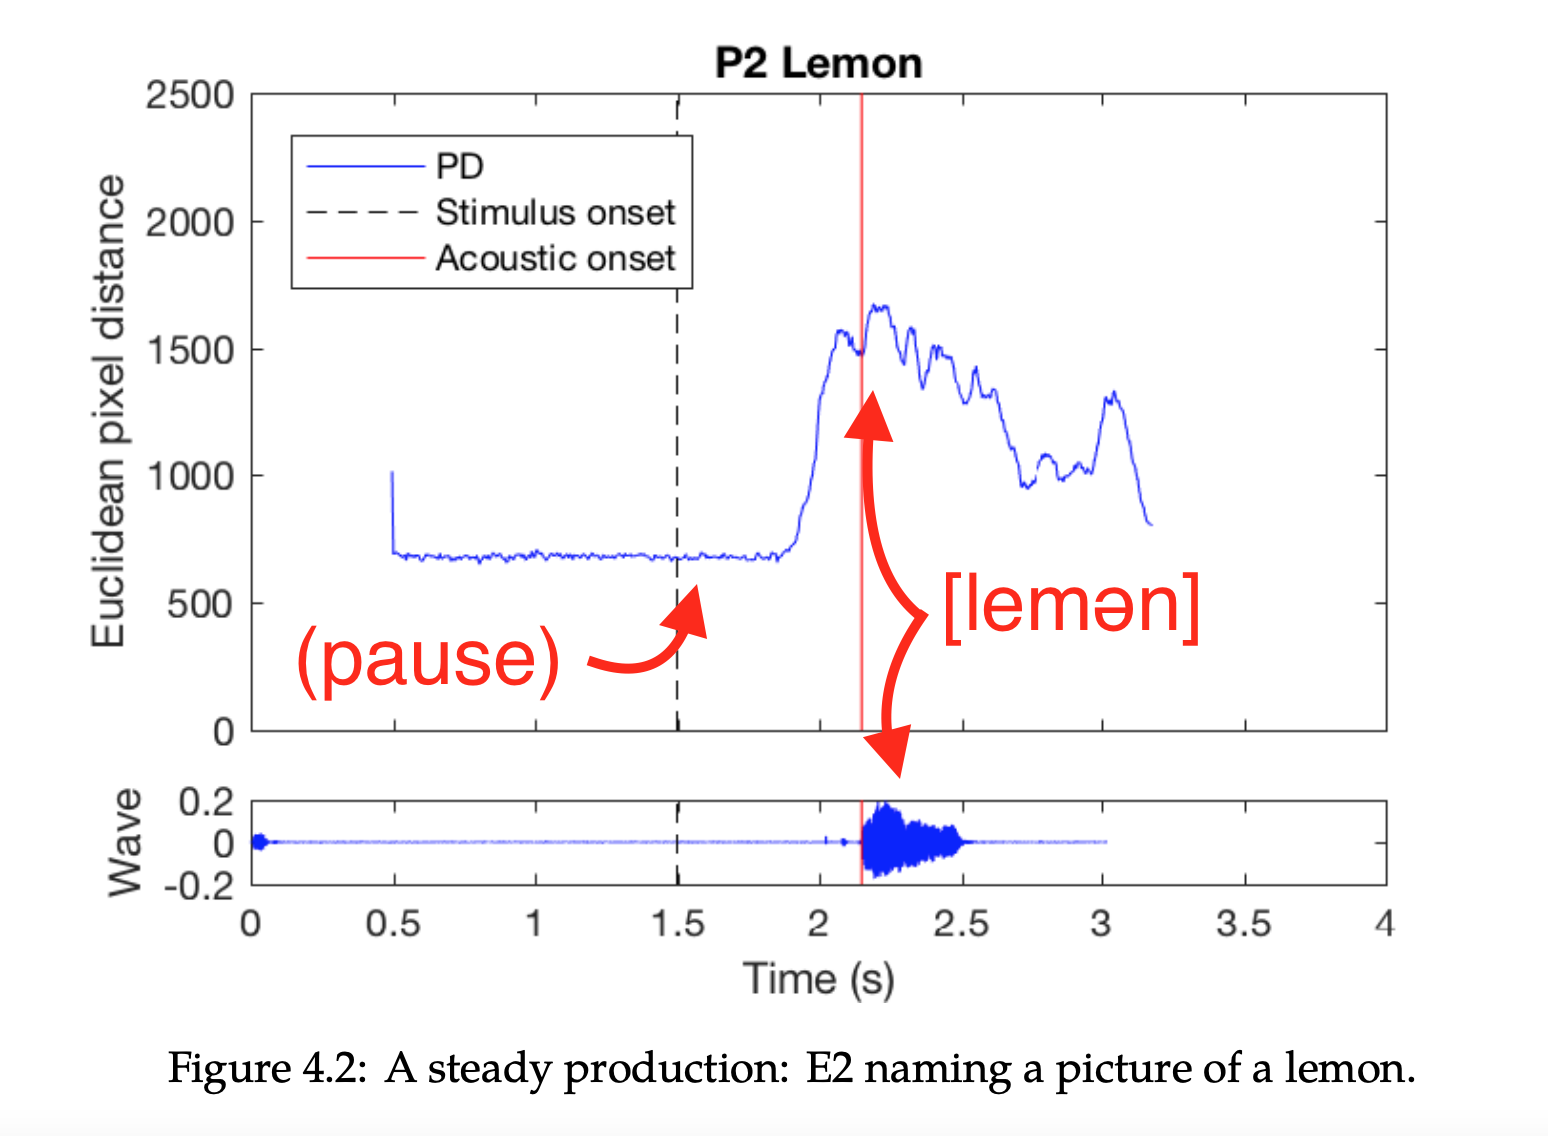
Tongue position change means pixels change in brightness from frame to frame

The Euclidean distance of two frames in terms of all their pixels can be used as a measure of tongue movement figure from Palo (2019)

Definition

Defining PD more precisely Palo (2019):

Step size

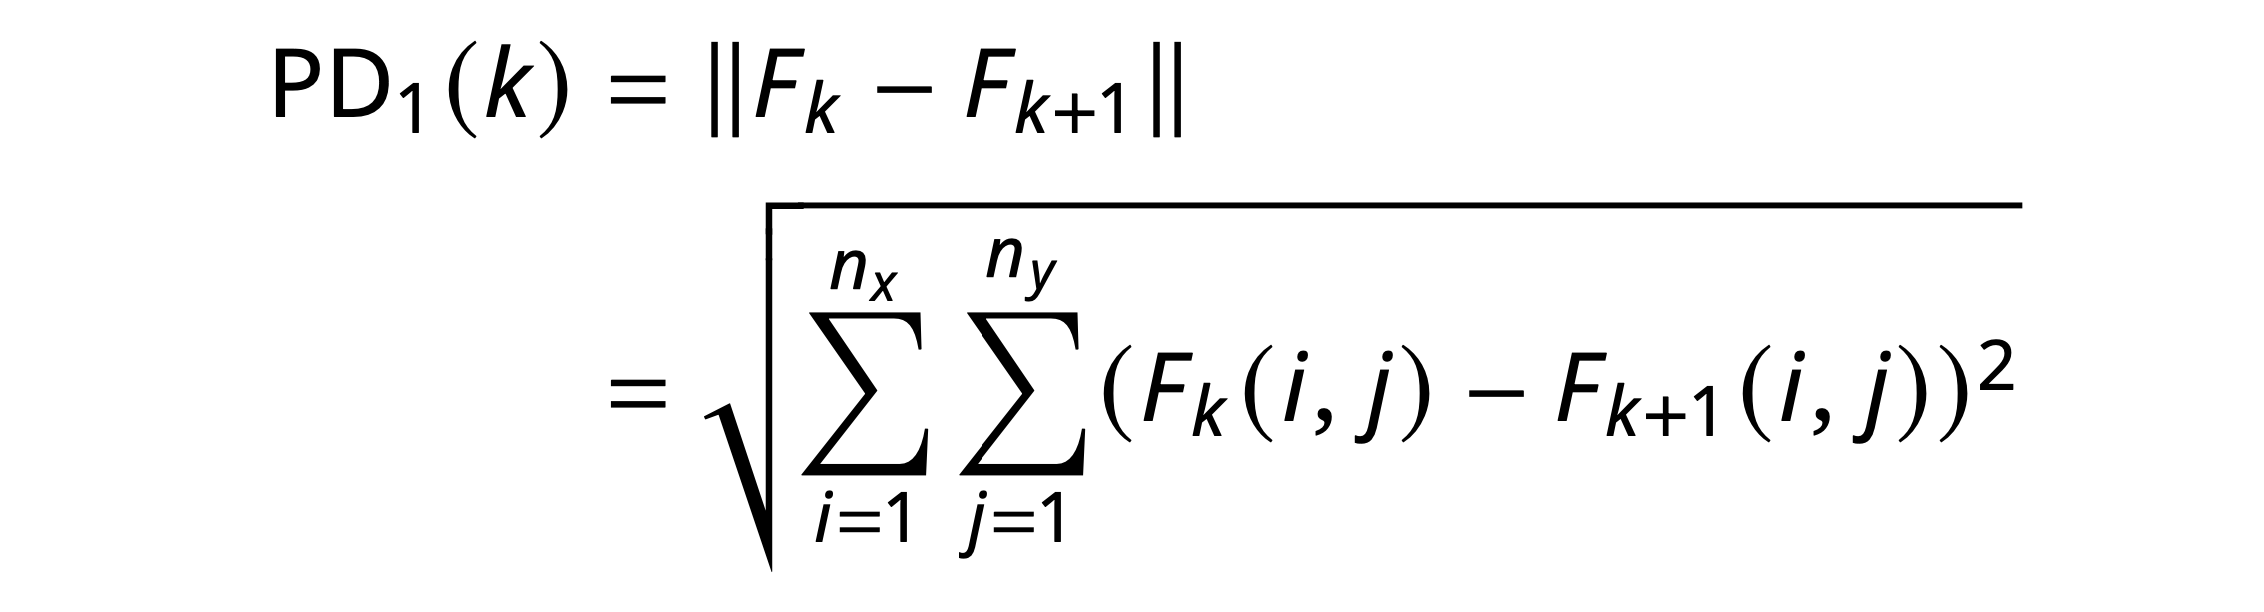
We can calculate the difference over successive frames (step size 1), or over frames more separated in time (step size L)

Palo (2019) mainly uses a step size of 1

Applications of PD

Movement detected includes intrinsic tongue muscles, unlike other measures discussed so far

Various psycholinguistic applications McMillan & Corley (2010); Palo (2019)

Optical flow (OF)

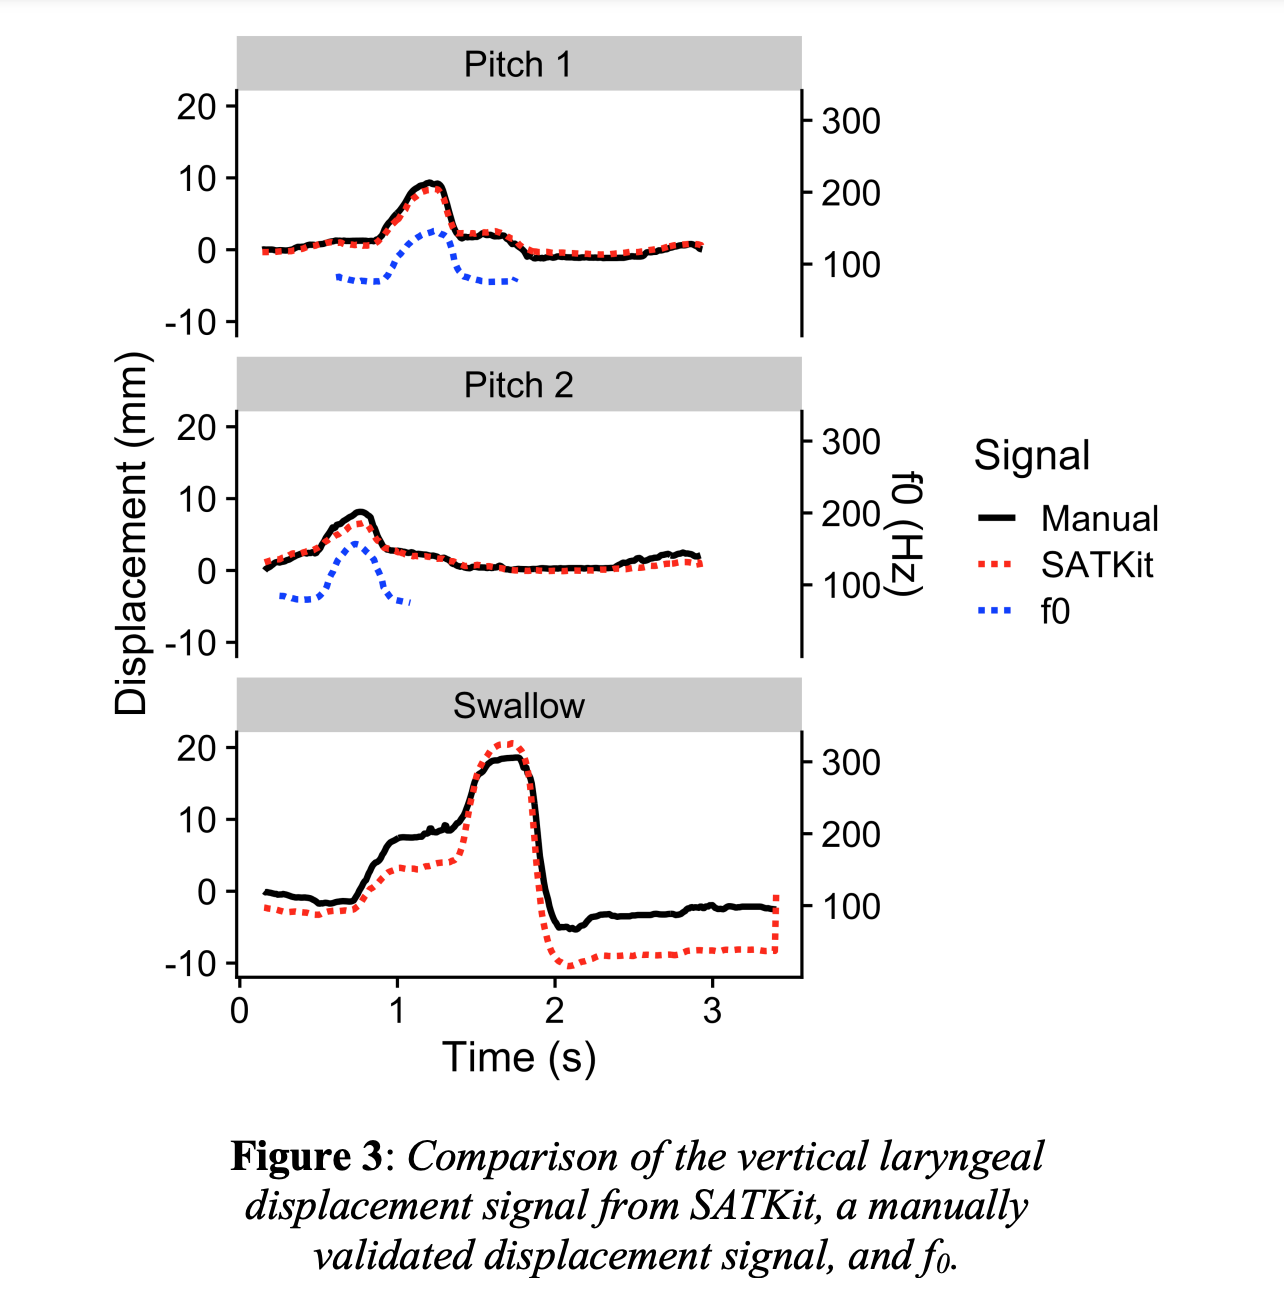
Related but more computationally complex: optical flow, which detects apparent motion between two frames Horn & Schunck (1981)

Applications of OF

Integrating the velocity signal gives amount of displacement for rigid bodies (i.e. the larynx) Moisik et al (2014); figure from Faytak, Moisik & Palo (2021)

Pixel dimensionality reduction

Pixel dimensionality reduction

Dimensionality reduction carried out not on ultrasound contours, but on entire ultrasound frames

Brightness values can be used as raw data for dimensionality reduction

Pixels and scan lines

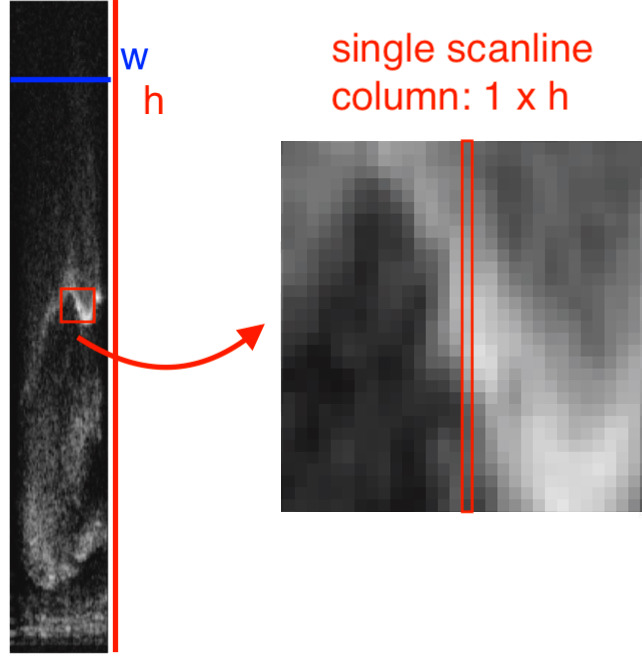
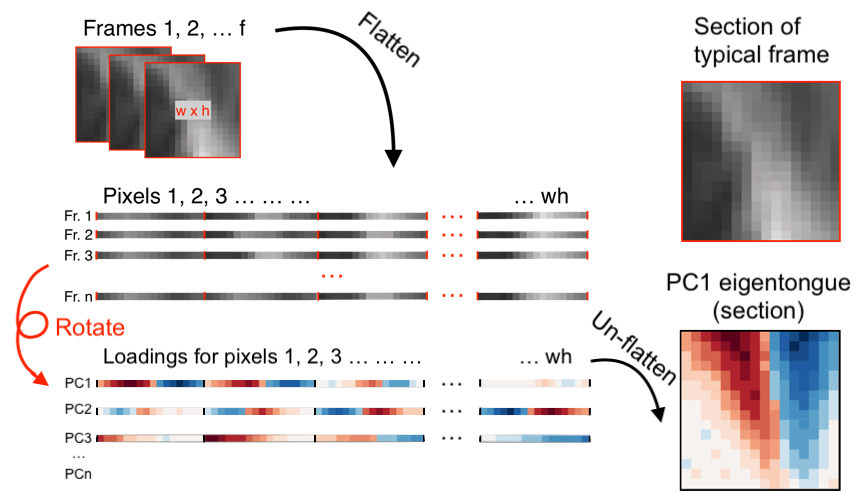
Each ultrasound frame can be thought of as a matrix of width w by height h

High dimensionality

Each pixel at location x, y across data sets with the same frame size w × h can be thought of as a separate feature

Challenge for feature selection:

Recap: dimensionality reduction

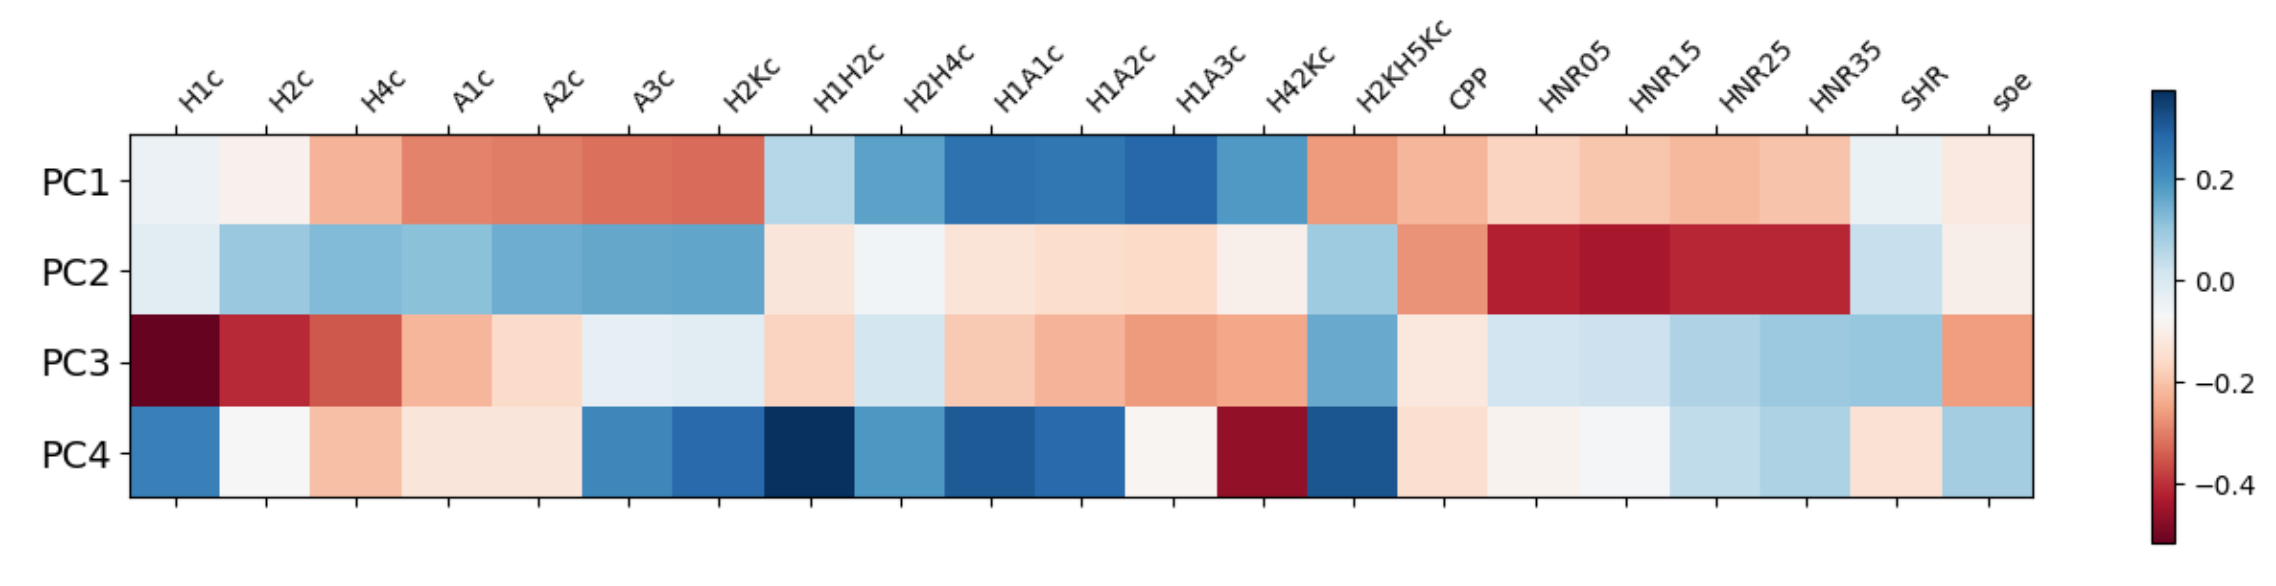
PCA outputs eigenvectors and eigenvalues

We might recall this was applied to numerous acoustic measures in our first notebook

Eigenvector loadings:
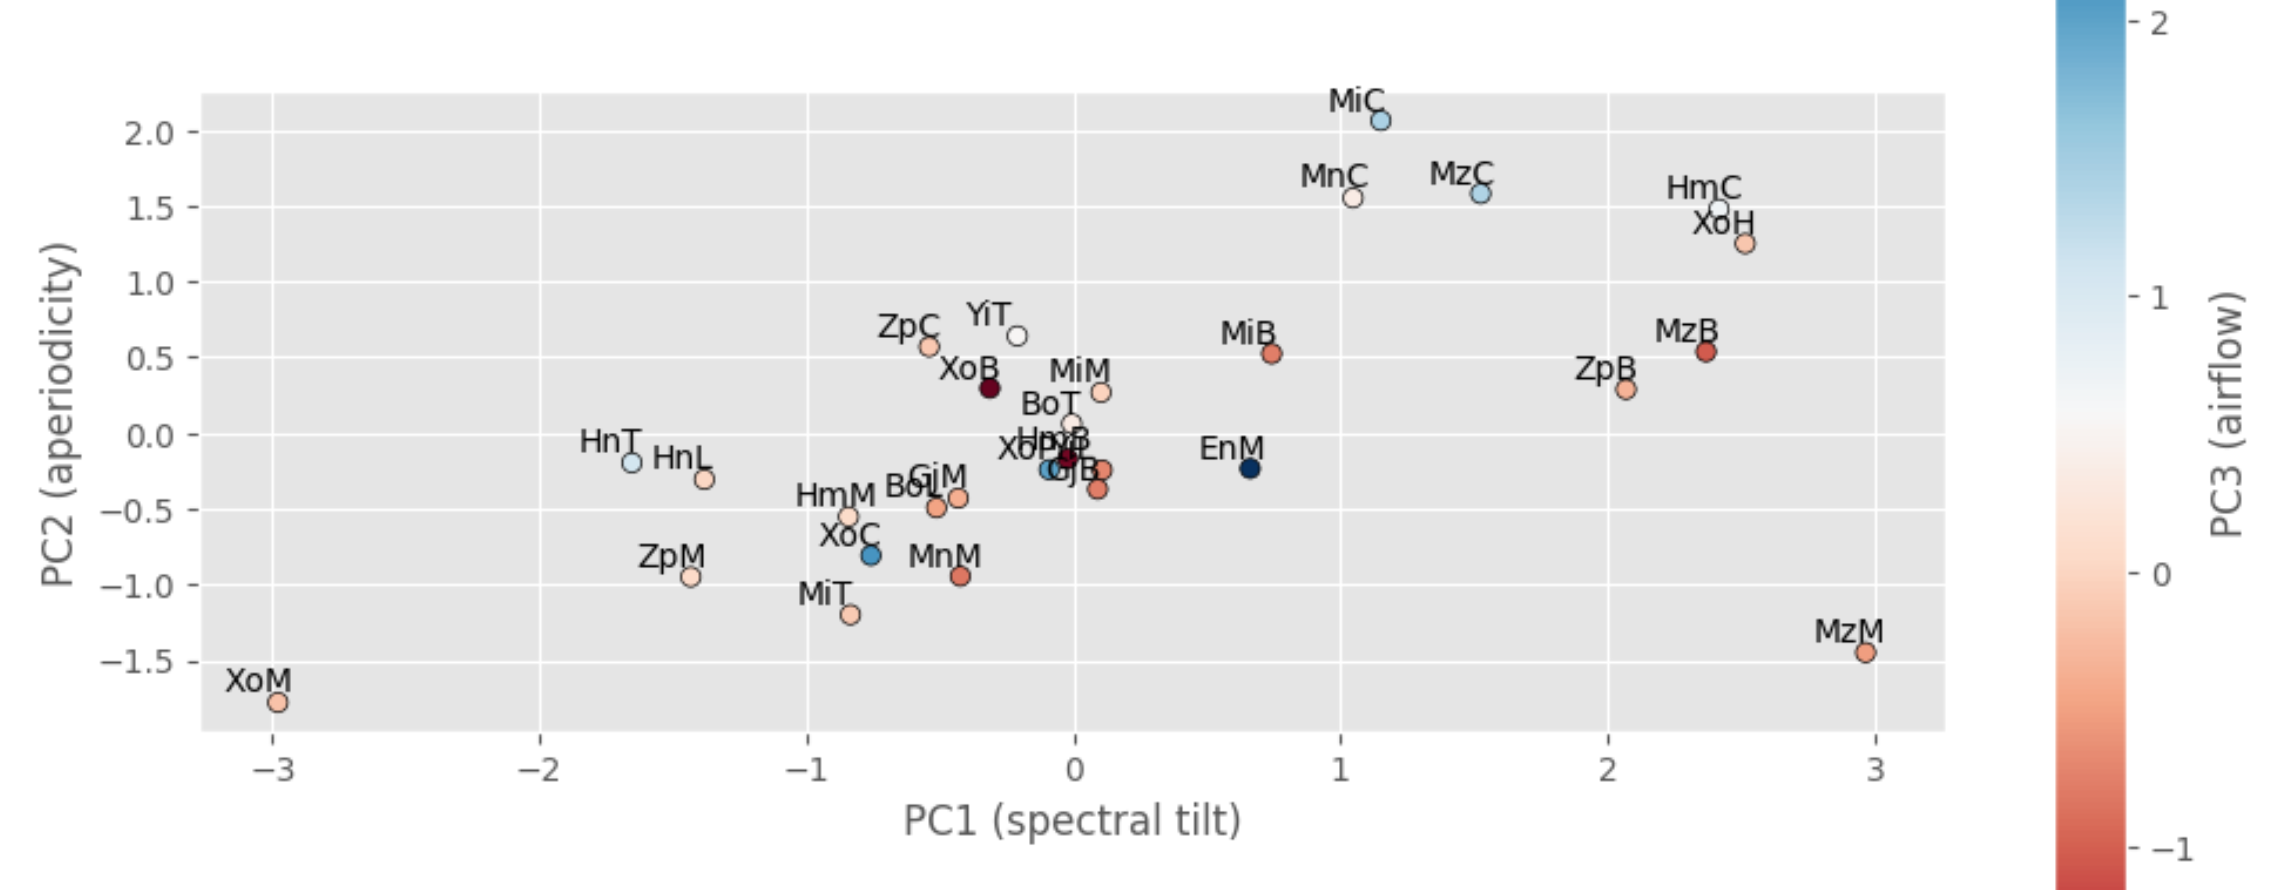
Data in PC space:

Calculating image eigenvectors

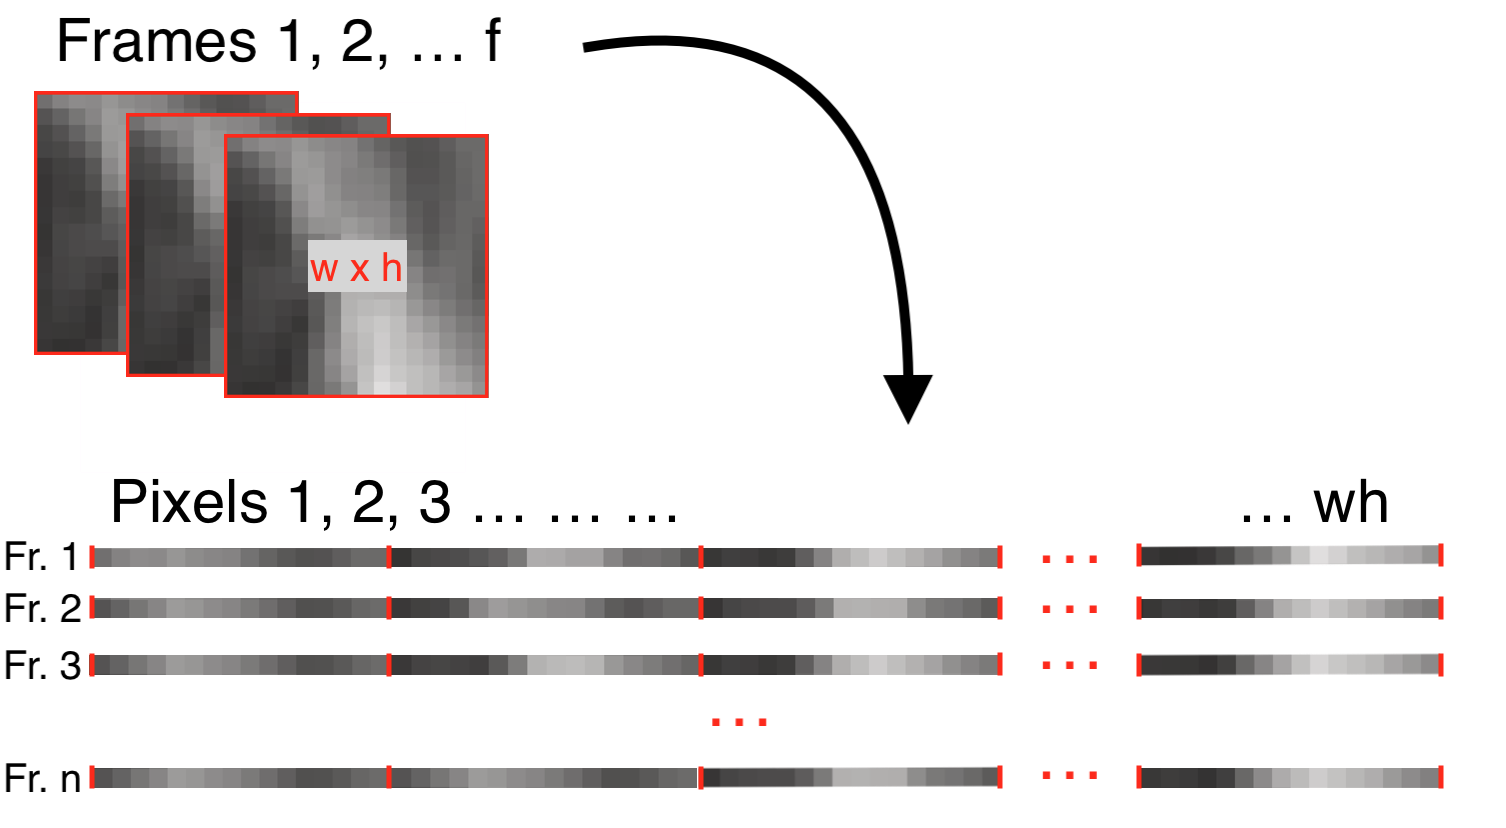
Method can be extended to image data: pixels in an image of shape w × h are treated as a very long list of features of length wh

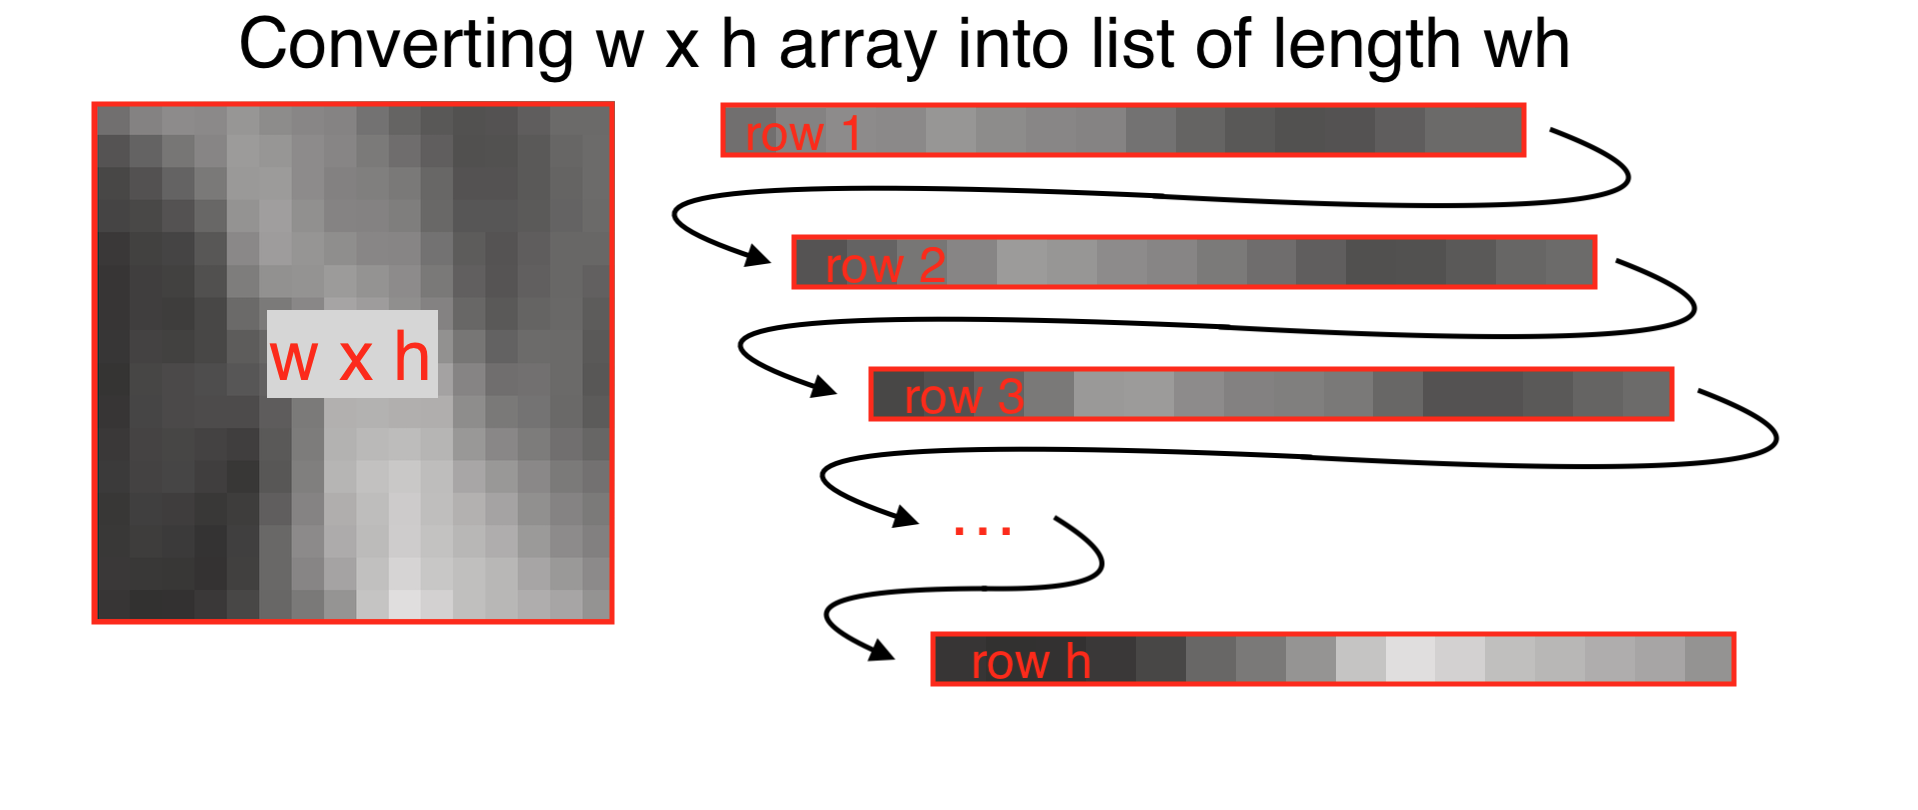
Like in the notebook’s dataframe:

Eigenvectors as eigenpictures

Convert our length wh eigenvectors back to w × h grids to get impact of associated PCs on pixel brightness in physical space Sirovich & Kirby (1987)

We could reshape our notebook’s eigenvectors, but because feature number doesn’t correspond to physical space, it doesn’t really gain us anything

Eigenfaces

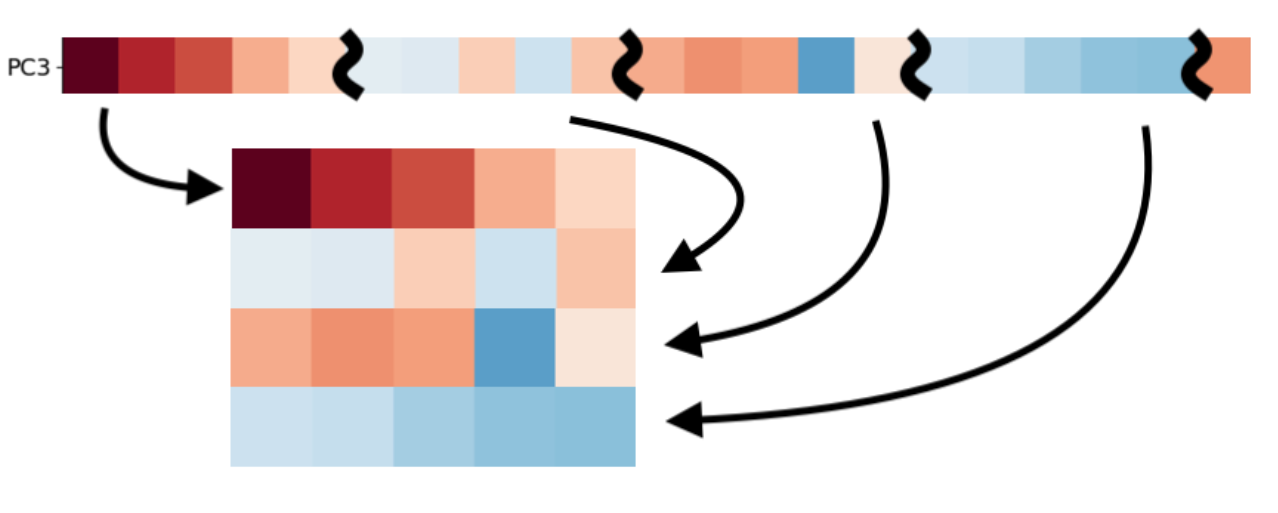
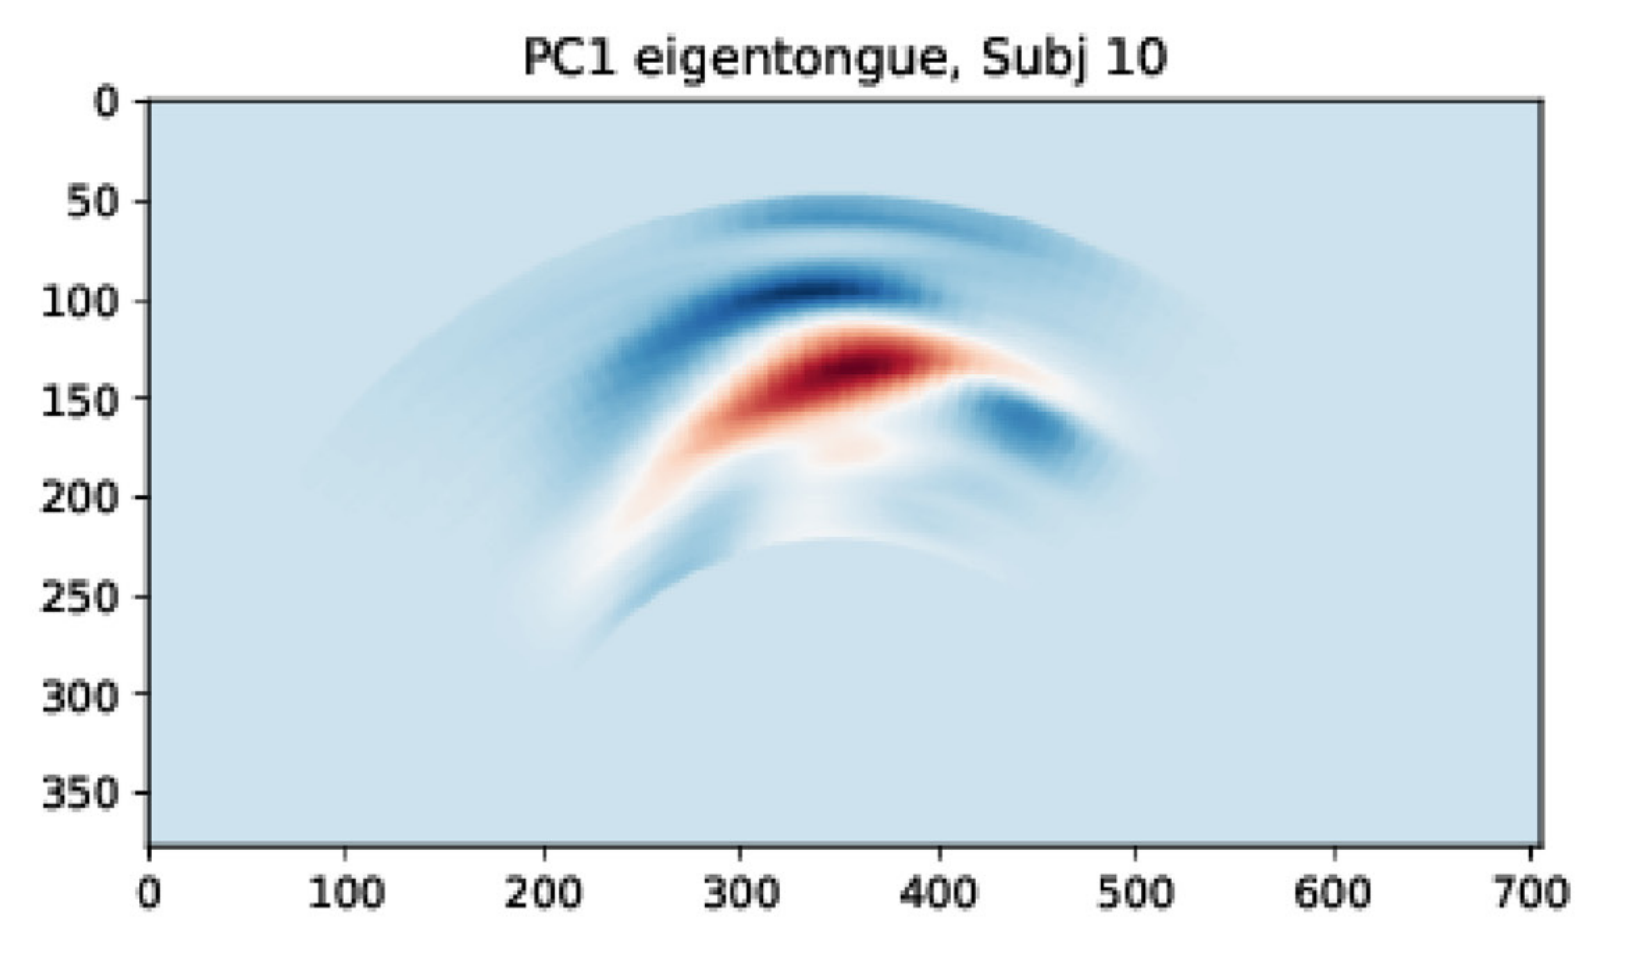
When the features correspond to physical position (i.e. of pixels), eigenpictures tell us more: figures from Turk & Pentland (1991)

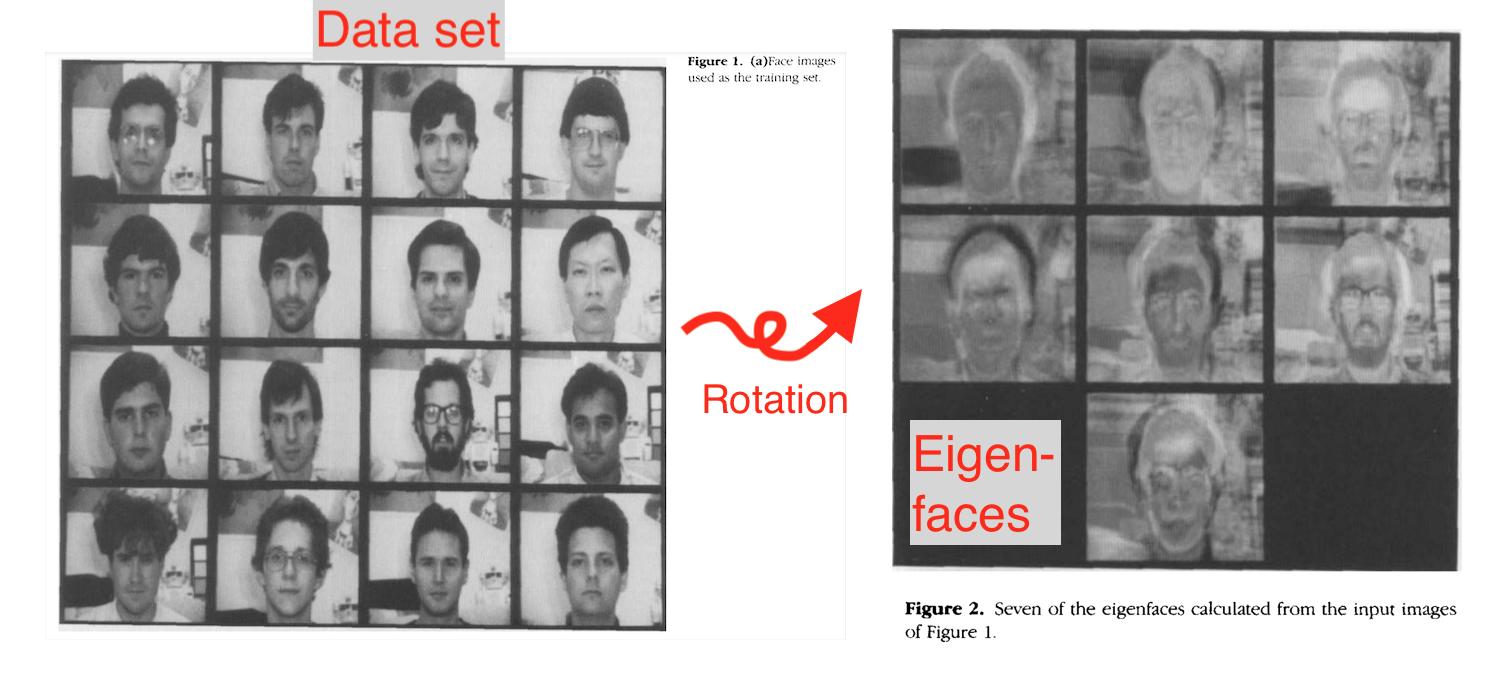
Eigenfaces show variation in shape and size of facial features, hair, and setting (lighting, pose, etc)

Eigentongues

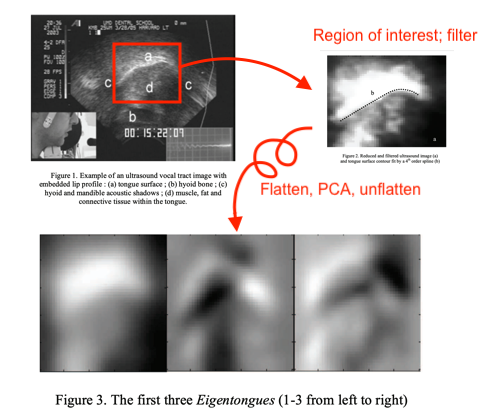
Hueber et al (2007) coined eigentongues, from eigenfaces

Eigentongues

Another example, from all tongue postures in a corpus, at a lower spatial resolution figures from Hueber et al (2007)

PC scores

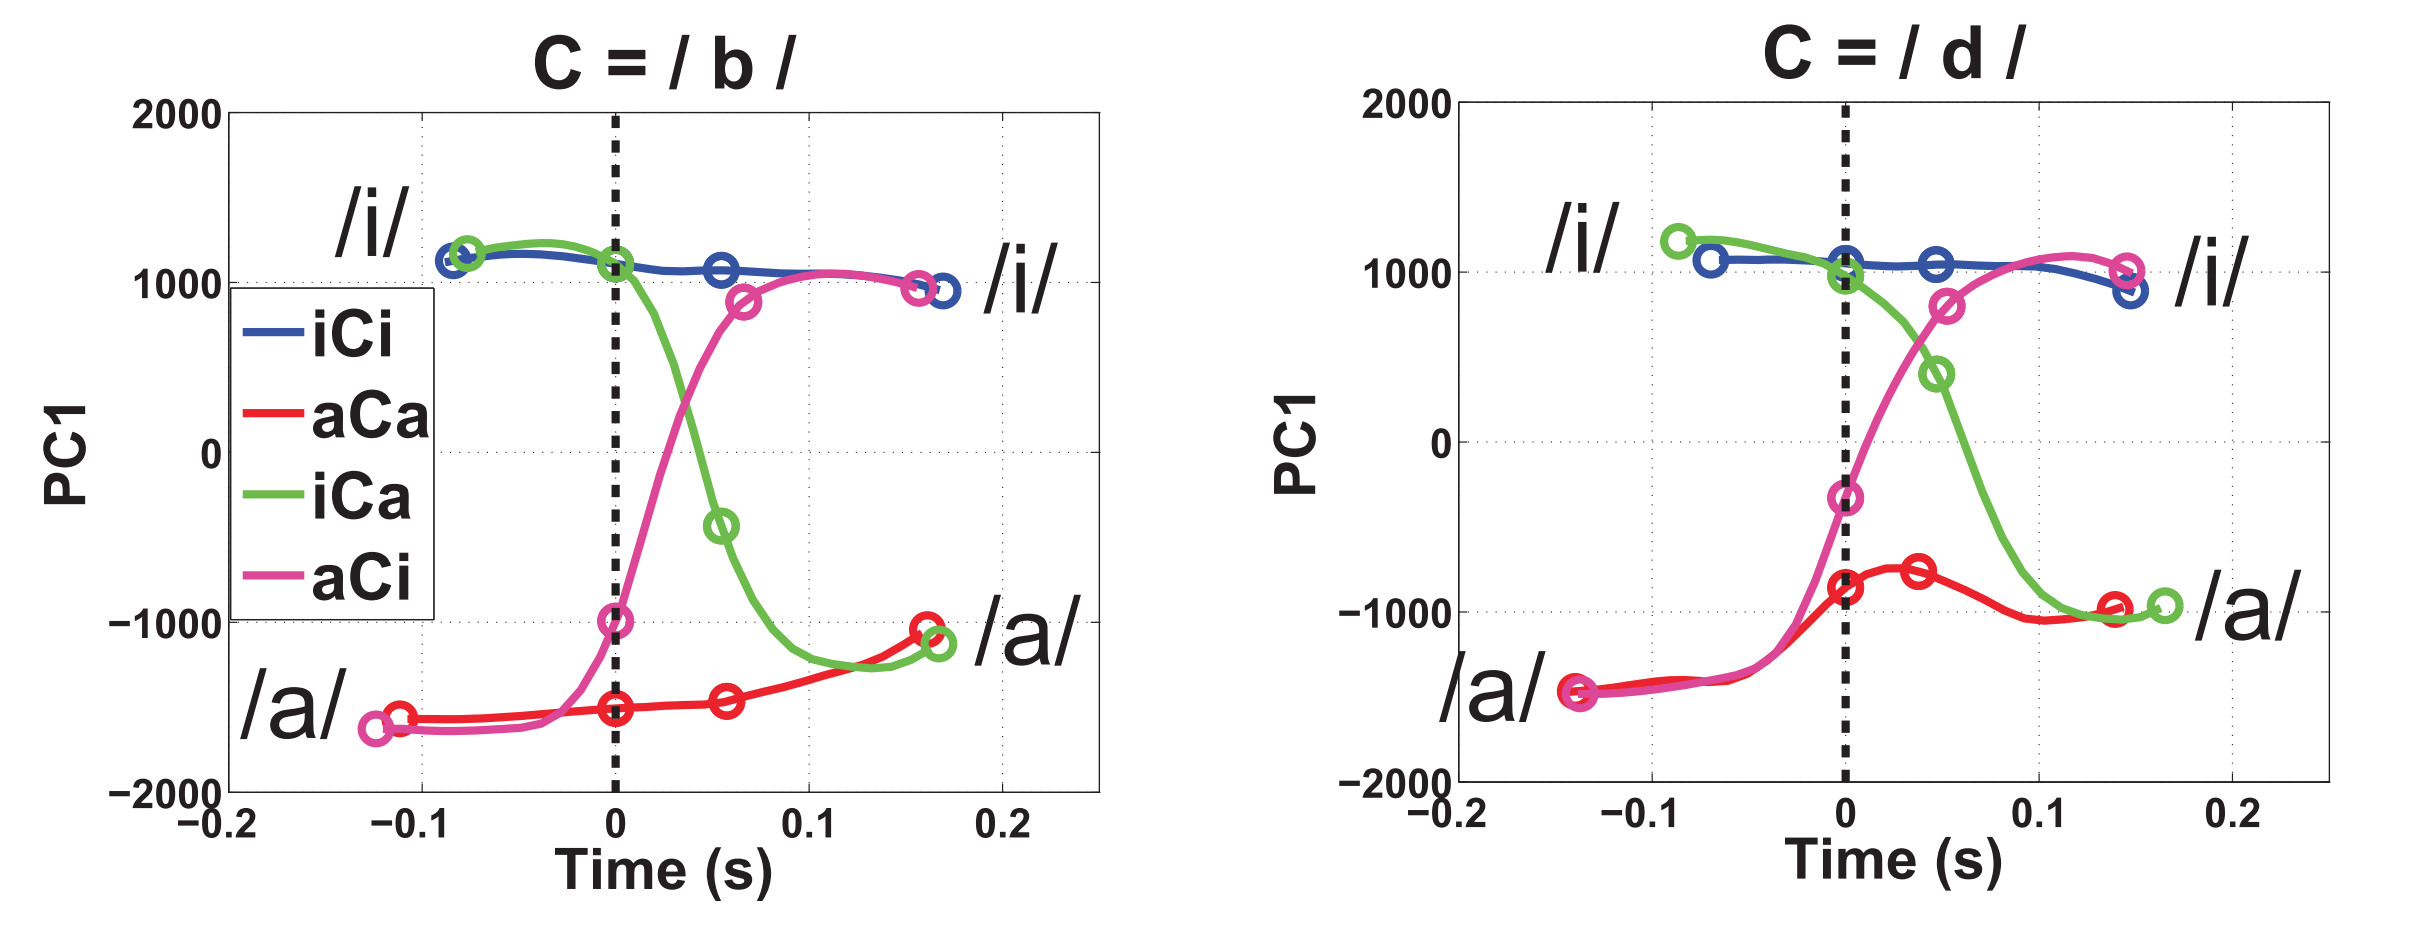
We can now characterize our ultrasound image data set in terms of the PC scores for each eigentongue

Applications of eigentongues

Feature engineering

On a practical level, avoids feature selection problems by making new ones; avoids time-consuming process of contour extraction

We can also do some neat tricks with eigentongues which aren’t easy with other approaches

Time series of PC scores

Sequences of frames can be fed to PCA instead of frames at a single point of interest (i.e. midpoint); yields time series data Mielke et al (2017); Hoole & Pouplier (2017); Smith et al (2019)

Linear discriminant analysis

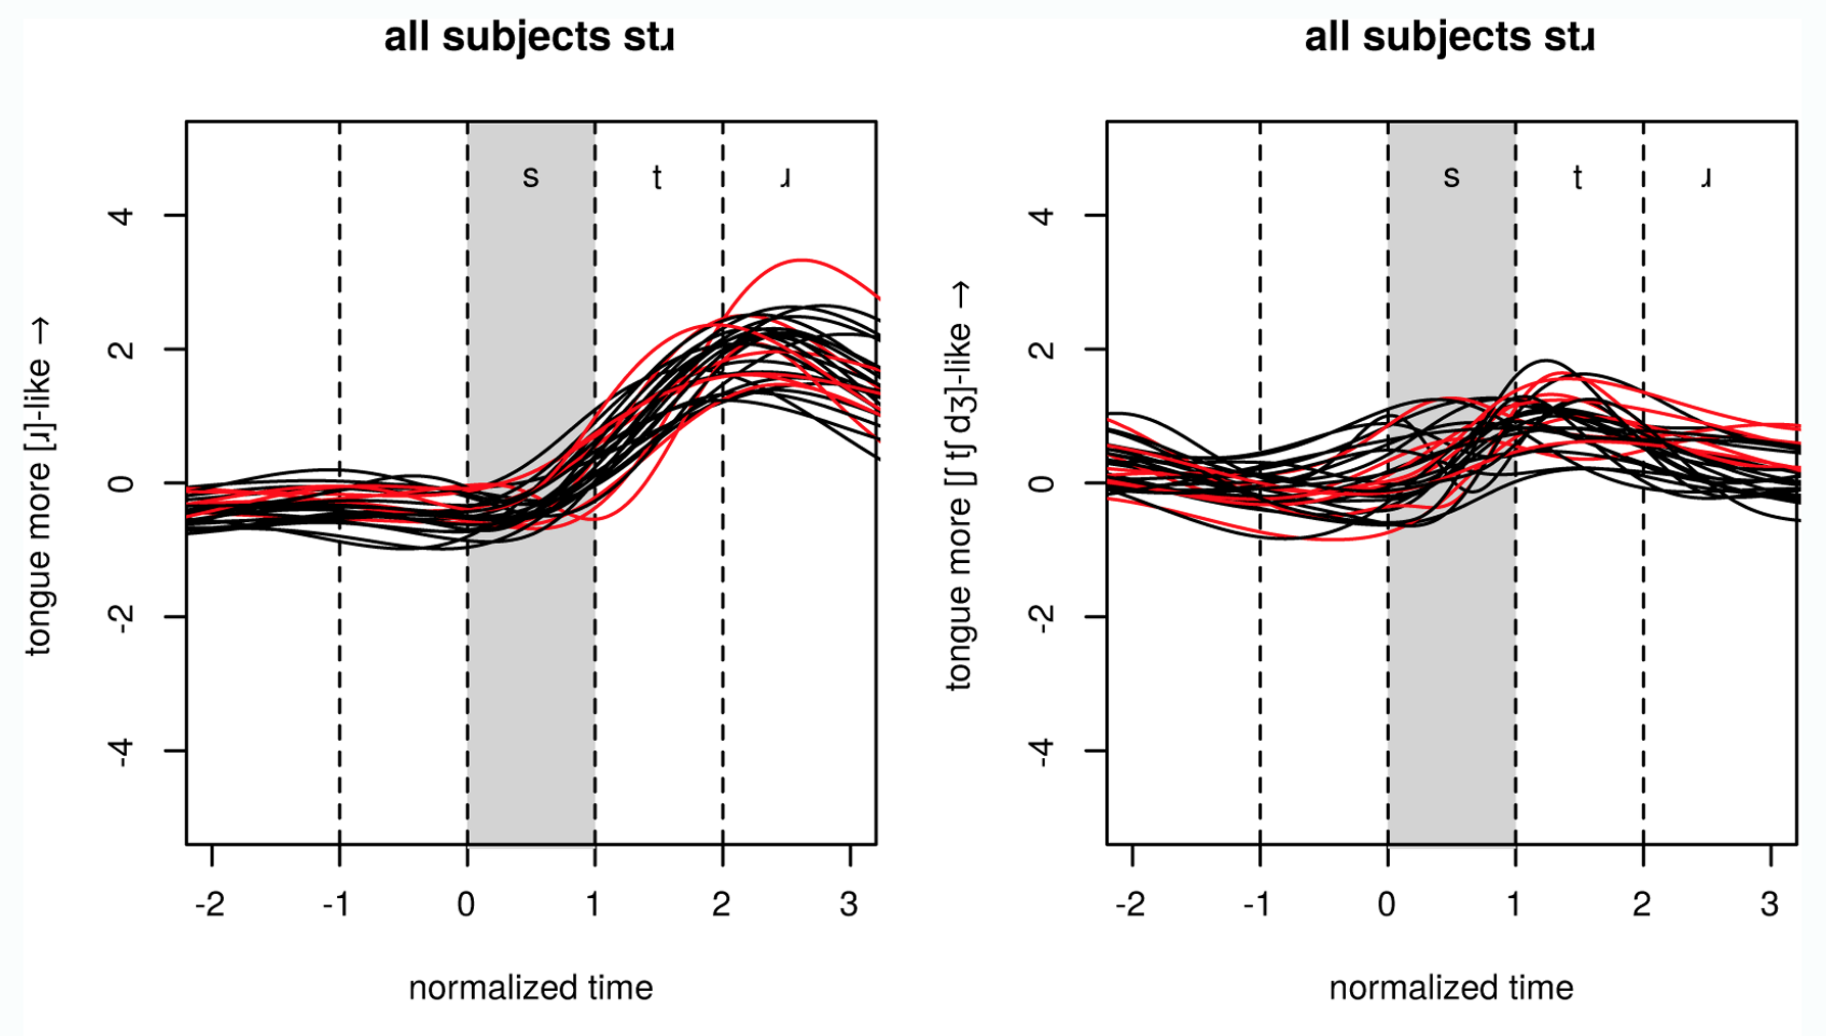
Another dimensionality-reduction technique which eigentongue PC scores can be submitted to see Carignan (2019)

Reconstruction

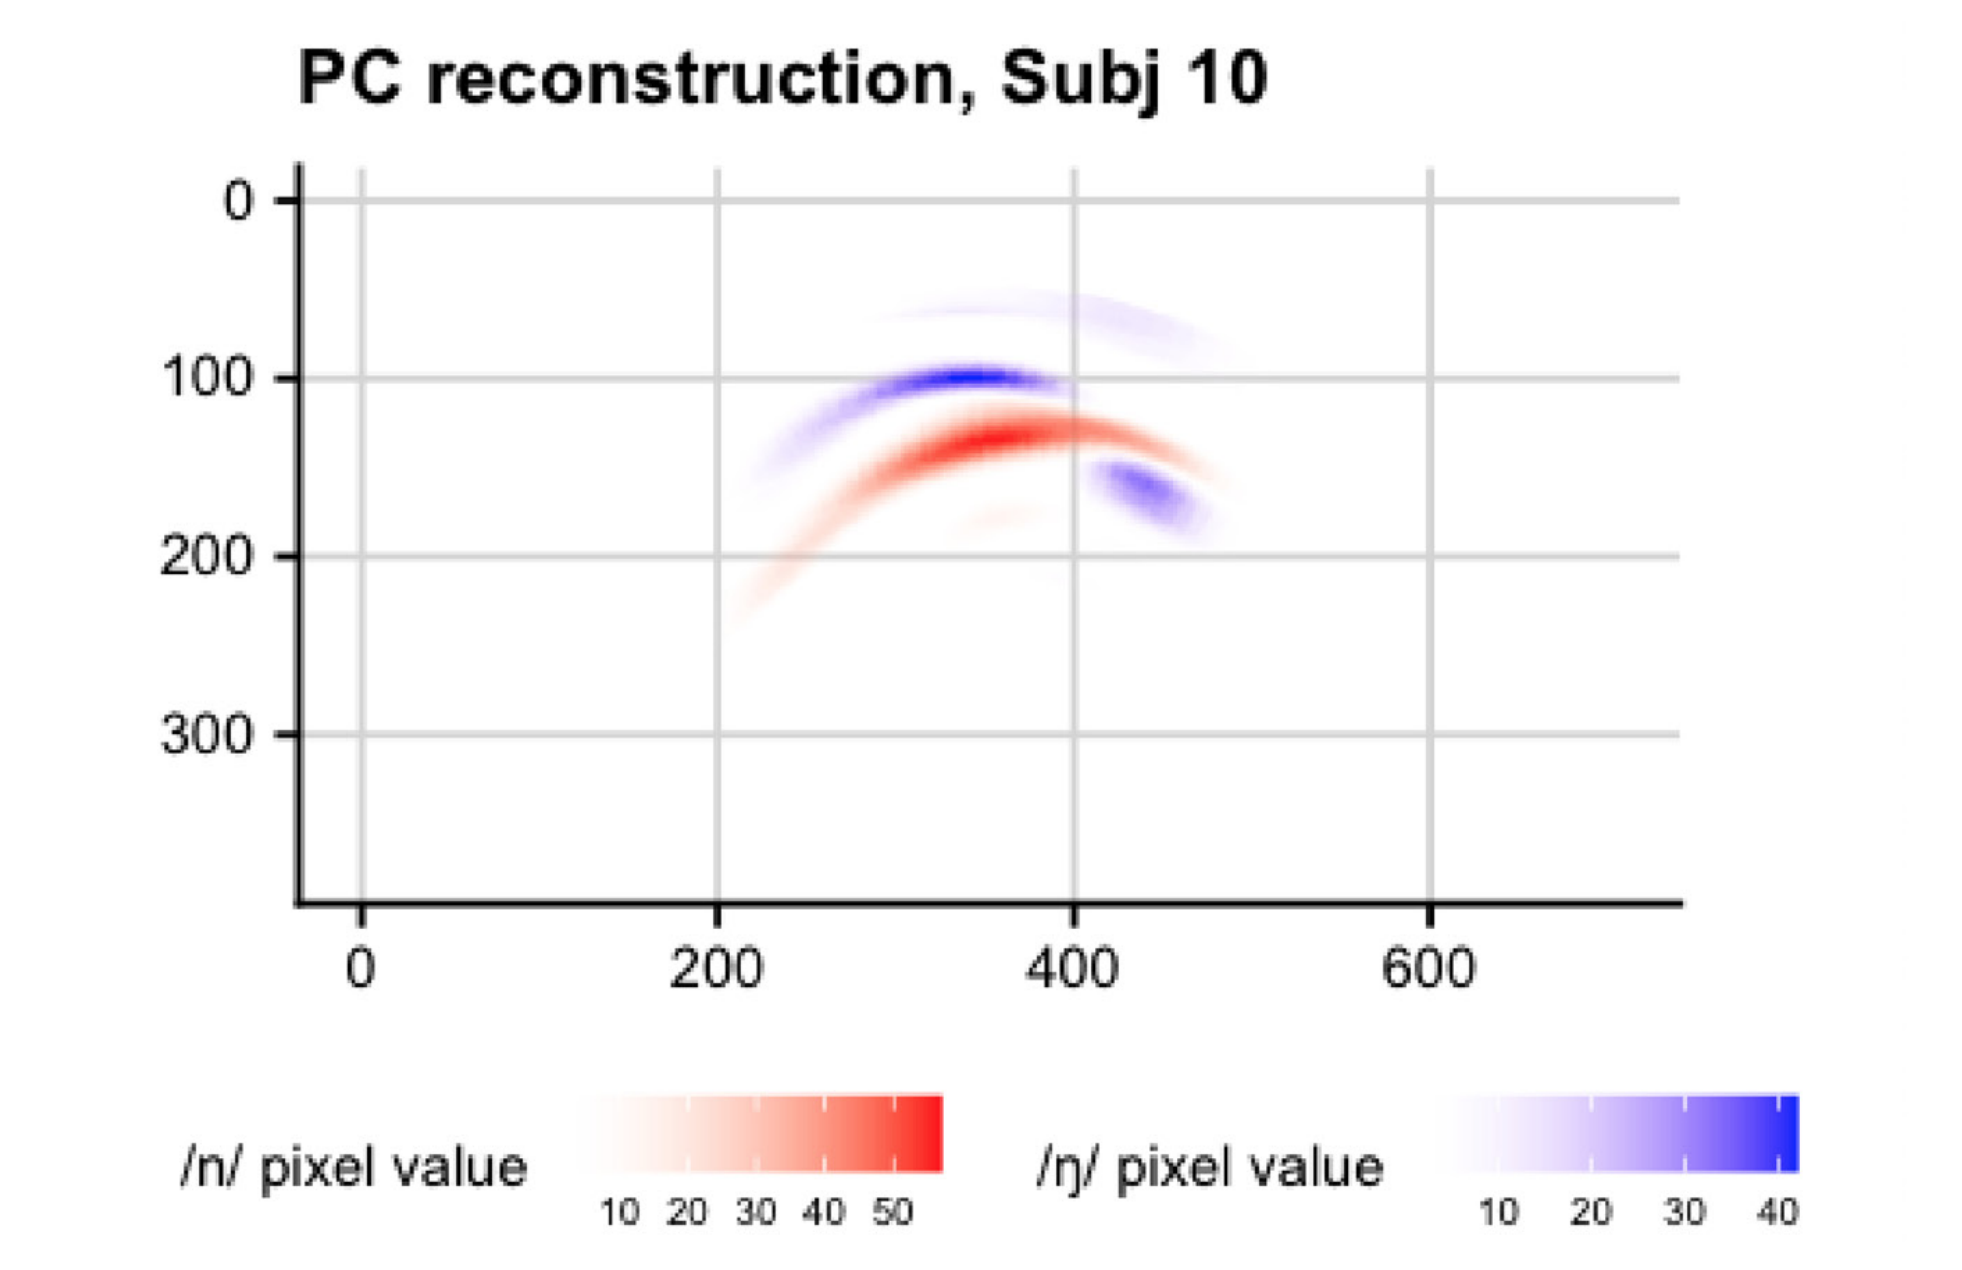
Weighted combinations of eigentongues can reconstruct observations Hoole & Pouplier (2017); Faytak et al. (2020)

Specifically, an image Γ can be reconstructed as linear combination of m eigentongues: Berry (2012)

where um is the mth eigentongue and ωm is the projection of Γ onto the mth eigentongue (i.e. PC score)

Reconstruction

Creates a denoised version of the observation figures from Faytak et al. (2020)

Wrapping up

Pixel methods: pros

Very efficient once the basics are mastered

Pixel methods easy to use on other data types

Pixel methods: cons

Fairly different from some approaches to analysis

Eigentongue analysis only works properly within single speakers

Up next: second notebook

Our final lecture will cover a Python implementation of eigentongue methods from my recent work

If you are curious about how to implement pixel difference or optical flow in Python:

References

Berry, J. (2012). Machine learning methods for articulatory data. Doctoral dissertation, University of Arizona. PDF

Bregler, C. & Konig, Y. (1994). “Eigenlips” for robust speech recognition. In Proceedings of ICASSP ’94 Vol. 2. DOI

Danilouchkine, M., Mastik, F. & van der Steen, A. (2009). A study of coronary artery rotational motion with dense scale-space optical flow in intravascular ultrasound. Physics in Medicine and Biology, 54(6), 1397–1418. DOI

Carignan, C. (2019). TRACTUS (Temporally Resolved Articulatory Configuration Tracking of Ultrasound). Software. GitHub

Davidson, L. (2006). Comparing tongue shapes from ultrasound imaging using smoothing spline analysis of variance. The Journal of the Acoustical Society of America, 120, pp. 407–415. DOI

Eshky, A., Cleland, J., Ribeiro, M., Sugden, E., Richmond, K. & Renals, S. (2021). Automatic audiovisual synchronisation for ultrasound tongue imaging. Speech Communication, 132, 83-95. DOI

Faytak, M., Moisik, S. & Palo, P. (2021). The Speech Articulation Toolkit (SATKit): Ultrasound image analysis in Python. In Proceedings of ISSP 12, 234-237. PDF

Faytak, M., Liu, S. & Sundara, M. (2020). Nasal coda neutralization in Shanghai Mandarin: Articulatory and perceptual evidence. Laboratory Phonology, 11(1), 23. DOI

Heyne, M., Derrick, D., & Al-Tamimi, J. (2019). Native language influence on brass instrument performance: An application of generalized additive mixed models (GAMMs) to midsagittal ultrasound images of the tongue. Frontiers in Psychology, 2597. DOI

Hoole, P. & Pouplier, M. (2017). Öhman returns: New horizons in the collection and analysis of imaging data in speech production research. Computer Speech & Language, 45, 253-277. DOI

Horn, B., & Schunck, B. (1981). Determining optical flow. Artificial Intelligence, 17(1), 185–203. DOI

Hueber, T., Aversano, G., Chollet, G., Denby, B., Dreyfus, G., Oussar, Y., Roussel, P. & Stone, M. (2007). Eigentongue feature extraction for an ultrasound-based silent speech interface. In Proceedings of ICASSP ’07 Vol. 1. DOI

Iskarous, K. (2005). Detecting the edge of the tongue: A tutorial. Clinical Linguistics & Phonetics, 19(6-7), 555-565. DOI

Krause, P., Kay, C. & Kawamoto, A., (2020) Automatic motion tracking of lips using digital video and OpenFace 2.0, Laboratory Phonology 11(1), 9. DOI

McMillan, C. & Corley, M. (2010). Cascading influences on the production of speech: Evidence from articulation. Cognition, 117(3), 243–260. DOI

Mielke, J., Carignan, C. & Thomas, E. (2017). The articulatory dynamics of pre-velar and pre-nasal /æ/-raising in English: An ultrasound study. The Journal of the Acoustical Society of America, 142(1), 332-349. DOI

Moisik, S., Lin, H., & Esling, J. (2014). A study of laryngeal gestures in Mandarin citation tones using simultaneous laryngoscopy and laryngeal ultrasound (SLLUS). JIPA, 44(1), 21– 58. DOI

Oh, M., & Lee, Y. (2018). ACT: An Automatic Centroid Tracking tool for analyzing vocal tract actions in real-time magnetic resonance imaging speech production data. The Journal of the Acoustical Society of America, 144(4), EL290-EL296. DOI

Palo, P. (2019). Measuring pre-speech articulation. Doctoral dissertation, Queen Margaret University. PDF

Palo, P., Moisik, S. & Faytak, M. (2022). Speech Articulation Toolkit (SATKit). Software. GitHub

Smith, B., Mielke, J., Magloughlin, L. & Wilbanks, E. (2019) Sound change and coarticulatory variability involving English /ɹ/. Glossa: A Journal of General Linguistics 4(1), 63. DOI

Stone, M. (2005). A guide to analysing tongue motion from ultrasound images. Clinical Linguistics & Phonetics, 19(6-7), 455-501. DOI

Strycharczuk, P. & Scobbie, J. (2017). Whence the fuzziness? Morphological effects in interacting sound changes in Southern British English. Laboratory Phonology 8(1), 7. DOI

Turk, M. & Pentland, A. (1991). Eigenfaces for recognition. Journal of Cognitive Neuroscience, 3(1), 71-86. DOI

Weller, J., Faytak, M., Steffman, J., Mayer, C., Teixeira, G. & Tankou, R. (to appear). Supralaryngeal articulation across voicing and aspiration in Yemba vowels. In Proceedings of ACAL 51/52.

Wrench, A., & Scobbie, J. (2008). High-speed cineloop ultrasound vs. video ultrasound tongue imaging: Comparison of front and back lingual gesture location and relative timing. In Proceedings of ISSP 8. PDF